2026 YTD · MARKET REPORT
Crypto Casino Market Share 2026
An analysis of tracked on-chain external inflows across one fixed 50-operator comparison panel.
It is an operator's observed external inbound USD divided by the same-period total across the fixed 50-operator panel. It describes this tracked cohort and is not a worldwide market-size, revenue, GGR, or player-share estimate.
KEY TAKEAWAYS
Three comparable numbers
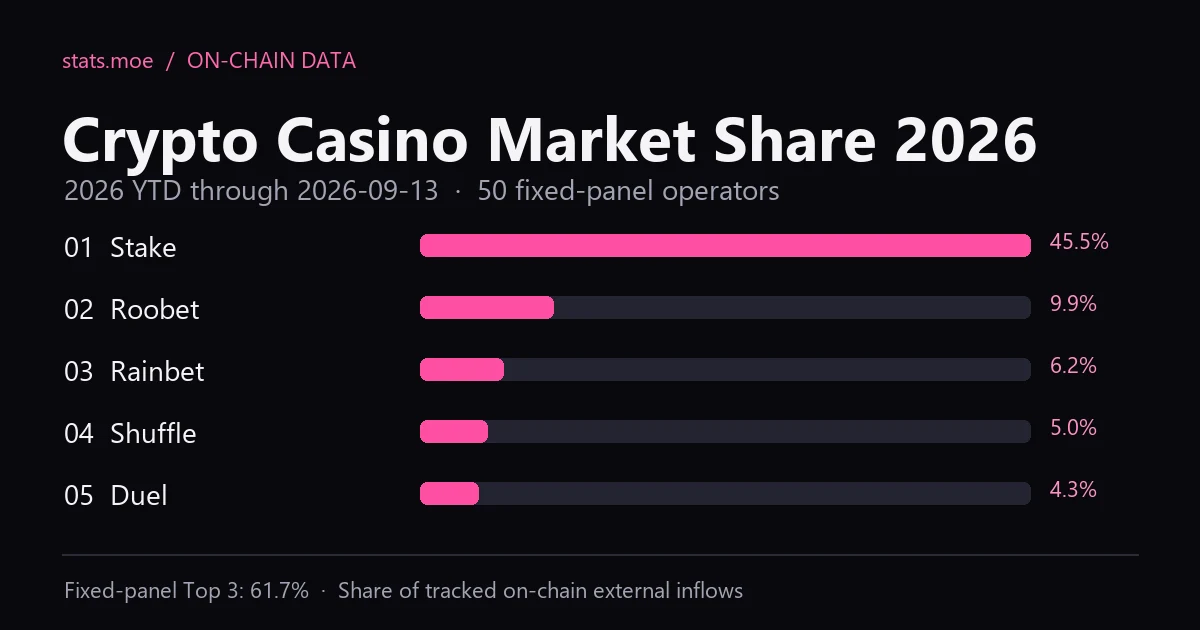
- Stake leads the fixed 50-operator panel with 45.5% share of observed external inbound value.
- Top 3 share is 61.7% — 3.3 pp lower compared with the same-duration 2025 YTD window.
- Fixed-panel observed inflows total $35.6B — 29.9% higher compared with the same-duration 2025 YTD window.
01 · OPERATOR RANKING
Top operators in 2026 YTD
This table compares 2026 YTD with a 2025 YTD window containing the same number of elapsed calendar days. Both sides use the identical fixed 50-operator membership, so share changes are like-for-like.
02 · SHARE MOVERS
Where the panel changed
These are the largest percentage-point changes against the same-duration 2025 YTD window. A gain or loss is relative to this fixed panel and does not measure global growth.
03 · CONCENTRATION
Fixed-panel concentration declined
Top 3 share moved from 65.0% in 2025 YTD to 61.7% in 2026 YTD. Both windows cover the same duration; Top 10 share is 85.1%.
04 · INFLOW VS SHARE
Panel inflows and operator share answer different questions
Panel total
The fixed 50-operator total measures aggregate observed external inflows over one period; it is not a global market-size estimate.
Operator share
Each operator share divides its observed value by that exact same-period panel total.
05 · METHODOLOGY
What the data does — and does not — measure
Observed external inbound transfers to attributed comparison-panel entities; not revenue, GGR, wagering handle, reserves, or unique users.
operator observed external inbound USD ÷ fixed-panel total for the same period
- No revenue, GGR, handle, reserves, or unique-player claim is made.
- Current-year values are labeled YTD in text, tables, structured data, and the chart image.
- Ranking, concentration, and trend calculations all use the same fixed panel.
06 · FAQ
How to read this ranking
Is this global crypto casino market share?
No. It is each operator's observed external inbound USD divided by the same-period total for this fixed 50-operator panel. It describes the tracked cohort, not worldwide market size, revenue, GGR, or player share.
What period does 2026 YTD cover?
The current window runs from 2026-01-01 through 2026-09-13 UTC. The comparison window is 2025-01-01 through 2025-09-13 UTC, with the same number of elapsed calendar days.
Why use a fixed comparison panel?
Keeping the same 50 operators in both windows prevents membership changes from looking like share gains or losses. The panel is a transparent comparison boundary, not a claim that it includes every operator.
Explore the live data
Use the evergreen page for selectable periods, long-range concentration, downloadable data, and operator profile links.
Explore the live crypto casino market share chart →